Although the recovery during Obama's second term in office was one of the most anemic in U.S. history, 2slugbait's conclusion was that a supply-side effort would not have produced an enduring benefit.
Voodoo economics not so great
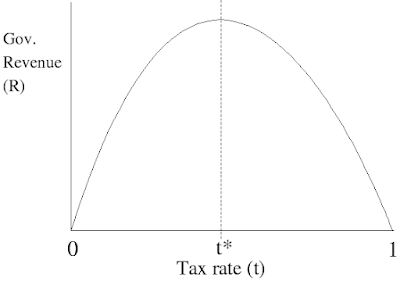
Economist Arthur Laffer was known for his Laffer curve. Laffer's recommendations about supply-side measures (rather than demand-side economic stimulus) were referred to as voodoo economics by detractors, most famously by former President George H.W. Bush.
2slugbait demonstrates empirically why supply-side economics was only
mildly effective. Specifically, neither of the following worked out the way supply-side economists posited at the time:
- cutting the top marginal tax rate would encourage greater labor efforts and
- more hours worked would have a greater net impact on increased personal savings than increased consumer spending would.
 |
| The (infamous?) Laffer curve |
Skepticism about David Stockman and Laffer's tax policy recommendations
during the Reagan Administration is the less interesting part to me. Tax cuts for middle-income wage earners (not
solely those high net worth "job creators" 😕😡 ) CAN provide a modicum of economic stimulus, even though it is not enduring! That was apparent from
2017 to March 2019, as well as the early 1980s.
Something else is much more interesting to me: The long-term decline in Real Potential GDP. 2slugbait noticed this too in his post.
Real Potential Gross Domestic Product
According to 2slugbait,
"If the Reagan tax cuts actually affected the supply side of the macro economy... then we should have observed an unparalleled increase in the growth rate of real potential GDP...
Yes, real potential GDP did grow at a pretty good clip immediately after the Reagan recession, but it quickly faded... even at its peak it was only barely above the growth rates during the Nixon, Ford, and Carter years and well below rates enjoyed during the LBJ and Clinton years."
Real potential GDP (let's refer to it for convenience in this post as RPGDP) is defined in the Federal Reserve Economic Data repository (FRED) as
"The Congressional Budget Office (CBO) estimate of the output the economy would produce with a high rate of use of capital and labor resources."
CBO measures RPGDP in non-seasonally adjusted billions of chained 2012 dollars and adjusts for inflation.
Frequency is quarterly.
Reagan era tax cuts were somewhat helpful. They resulted in temporary growth in RPGDP as the US economy lurched out of the late 1970s oil supply shock and 1980s stagflation.
The rate of growth of RPGDP stalled after the dot com bubble in 2000. It never returned to the historical levels of the prior 50 years. That is apparent in the single chart featured in the St. Louis Federal Reserve's 'Celebrating 25 Years of FRED' blog post of April 2016, as well as 2Slugbait's graphs of the year-on-year rate of change.
Reagan era tax cuts were somewhat helpful. They resulted in temporary growth in RPGDP as the US economy lurched out of the late 1970s oil supply shock and 1980s stagflation.
Growth was lackluster, then AND now
The rate of growth of RPGDP stalled after the dot com bubble in 2000. It never returned to the historical levels of the prior 50 years. That is apparent in the single chart featured in the St. Louis Federal Reserve's 'Celebrating 25 Years of FRED' blog post of April 2016, as well as 2Slugbait's graphs of the year-on-year rate of change.
 |
| 20 years of declining Real Potential GDP |
I wanted to confirm 2slugbait's findings by using more directly comparable data to what the CBO uses, i.e. seasonally-adjusted quarterly data (instead of non-seasonal, year-on-year data).
First, I extend the time interval, in both directions. I went to the
source for that, the St. Louis Federal Reserve's
FRED, available as the GDPPOT series .
I don't know. Shouldn't it have recovered to at least 1990s levels during the economic expansion of 2002 to 2007? We even had a war as fiscal stimulus!
Next, I took the
rate of change of the GDPPOT series, on a quarterly basis.
Recall that 2slugbait used
year-over-year, seasonally adjusted rates, while I used quarterly,
non-seasonally adjusted rates. My assumptions more closely correspond to
those of the CBO. I was curious if that would make any
difference.
It didn't. Our results are substantially the same.
Where did our Real Potential GDP go?
I don't know. Shouldn't it have recovered to at least 1990s levels during the economic expansion of 2002 to 2007? We even had a war as fiscal stimulus!
Real potential GDP
should have grown for some interval during the years 2012 to 2019 prior to COVID19. Is the CBO wrong perhaps? They are the source of the data. If I were 2slugbait, I would check on that.
I am merely Ellie. I don't have a PhD in econometrics. So supply-side economics didn't work as intended, that should be acknowledged; it is water under the bridge. There is still something very wrong with our economy and hollowing-out of our middle-class.
I feel like deleting this entire post, but no one ever reads them.
In writing this, I have learned a lot about FRED and ALFRED (vintage and historic economic data) and GEOFRED (geospatial economic data... EDIT: discontinued in 2022).

Hi Ellie. Hope the new job since 2016 worked out ok for you!
ReplyDeleteThe reason GDP is crimped might have to do with the greatest financial crime in history, operation: Black Eagle. We called it 9/11 colloquially.
The planes were a distraction from bullion bars and server racks. It's estimated that >$90 trillion of that amount is parked in the Caymans. It is to be used when we have a financial collapse that overseas "interests" will use to buy us for a penny on the dollar, completing the greatest theft in recorded history. It's where we are.